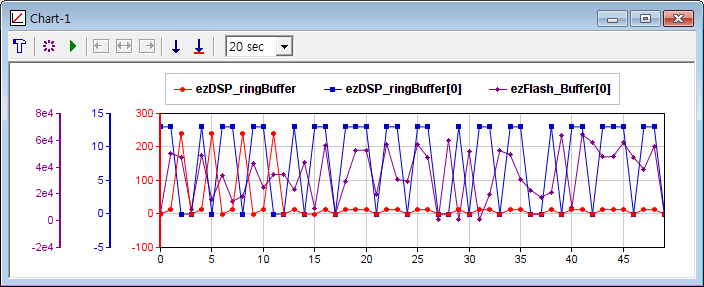
It displays all data of 1-dim array type variable. So, you can use it as
an software substitute for the oscilloscope, if your MCU program samples a certain
variable into this array variable.
Writing to the array is not
allowed in Chart window. It stops updating data when its window size
is minimized.
It displays the Q-format integer variable as its fractional
number. (Ex, 32bit integer with Q31 format is displayed in the range of +1/-1).
Chart windows read large amounts of data, which increases the communication
load between the MCU and easyDSP. Therefore, if communication fails
consecutively for a specified number of times, graph updates stop automatically,
and the following message appears.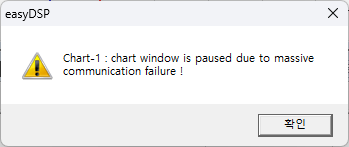
Toolbar
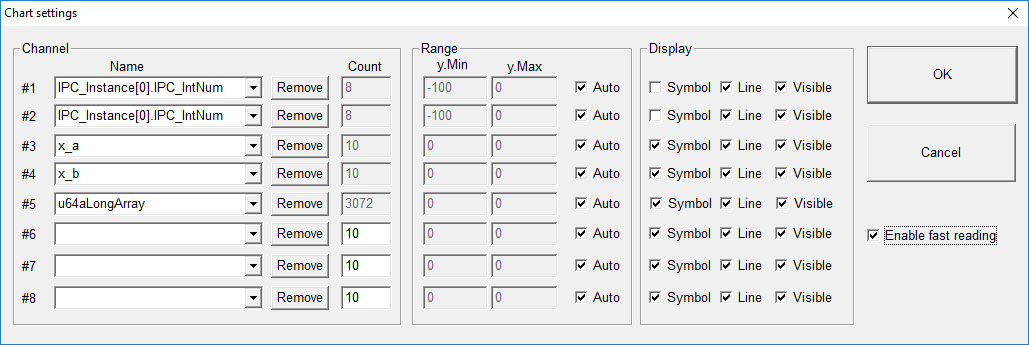
: When clicked, the below dialog box shows up and you can register upto 8 variables and its display properties.
'Channel' : You can select the one-dimensional array variable.
'Scale' : Select the Y-axis range. 'Auto' will adjust its scale automatically based on the variable values in every display.
'Display' : Determines its display mode. The data acquisition keeps going whatever its display mode is.
'Enable fast reading' : makes chart update faster when the MCU resource for communication with easyDSP is enough.
If this option is not working properly, the window becomes empty.The colors and symbols are predefined as follows.
channel #1 : red - circle
channel #2 : blue - square
channel #3 : green - triangle
channel #4 : violet - diamond
channel #5 : black - right triangle
channel #6 : weak green - left triangle
channel #7 : grey - '+' shape
channel #8 : orange - 'x' shape
: updates graph only for one time. If your data are too large, updating them in every sampling interval takes so much time. Please use this toolbar in that case.

(toggled) :pauses graph update / resumes graph update.
: shows left-most part of the graph
: shows all graph data.
: shows right-most part of the graph.
: saves the current graph into graphic file (bmp, jpg, png formats) or save the current graph data into text file (csv format).
: saves the graph data to record file (file extension = rec). You can open the record file with record window.
: update interval. If the values of numerous variables (including ones in other windows) are updated at the same time, the actual update interval will become longer than the configured value.
Useful features
- Please check the link how to use the graph